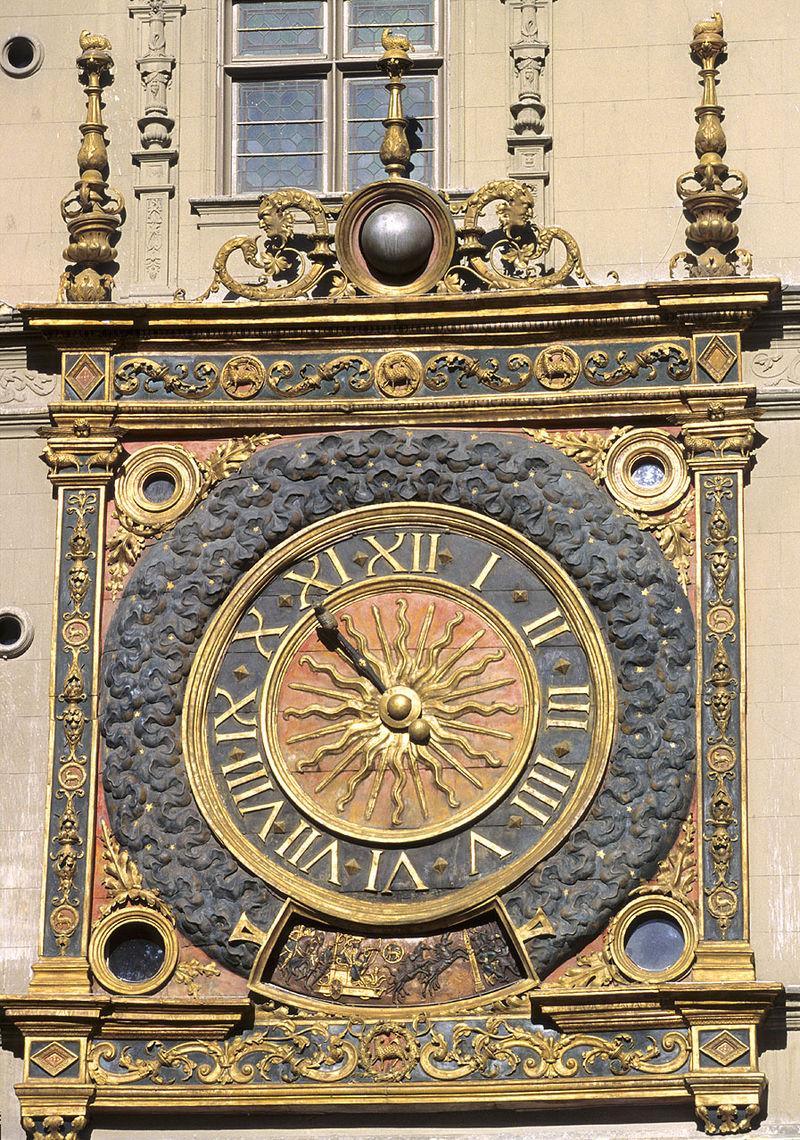
Comprendre la mesure du temps
La mesure du temps
Je suis depuis longtemps fascinée par notre mesure du temps. En fait, au début, j'étais horrifiée, surtout. Car c'est à n'y rien comprendre. Je me souviens encore avec douleur de longues sessions de mémorisations des jours de la semaine (pourquoi il y a des semaines ? Pourquoi il y a 7 jours dans une semaine ? Pourquoi les jours ont des noms si compliqués ??), des mois (pourquoi il y en a 12 ? Pourquoi ils ont des nombres de jours différents ??)... J'avais du mal et je voyais bien que j'épuisais la patience de mes parents car je trouvais ça trop difficile à retenir. Bon ça a fini par rentrer. C'est devenu "normal", bien que déplaisant. Et puis d'abord pourquoi il y a 60 secondes dans une minute, 60 minutes dans une heure, et pas 60 heures dans une journée ? C'est pas logique ! Arrgh.
Aujourd'hui, c'est parce que c'est aussi compliqué que ça me passionne. J'ai appris que mesurer le temps c'est important depuis si longtemps qu'on se coltine des vestiges de systèmes établis il y a des milliers d'années ! C'est un joyeux chaos parce qu'on hérite de systèmes établis par les Babyloniens, les Égyptiens, les Romains (et bien d'autres encore) ! Et on a gardé un gloubi-boulga de tout ça. Bon si ça ne tenait qu'à moi, je ferai une belle grosse réforme simplificatrice, mais en attendant, on peut toujours admirer tous ces témoins historiques.
Je vais essayer de décortiquer un peu pourquoi notre calendrier et nos unités de temps sont comme elles sont aujourd'hui. Et ça va être un sacré voyage. Je vais pas aborder comment ça se passe ailleurs parce que ça serait trop long et que je n'ai pas l'omniscience (encore).
La plupart du temps, j'ai fait un résumé (et des copier-coller !) de Wikipédia ou de livres que j'ai (astronomie, histoire des maths...). J'ai surtout essayé de faire un chemin compréhensible et condensé, plutôt accessible j'espère. Mon but n'est pas d’assommer avec plein de notions d'astronomie ou de leçons d'histoire interminables. La mesure du temps est un vaste sujet mais j'ai essayé d'aller à l'essentiel pour expliquer de la manière la plus satisfaisante possible toutes les questions qui m'ont un jour taraudée.
C'est parti !
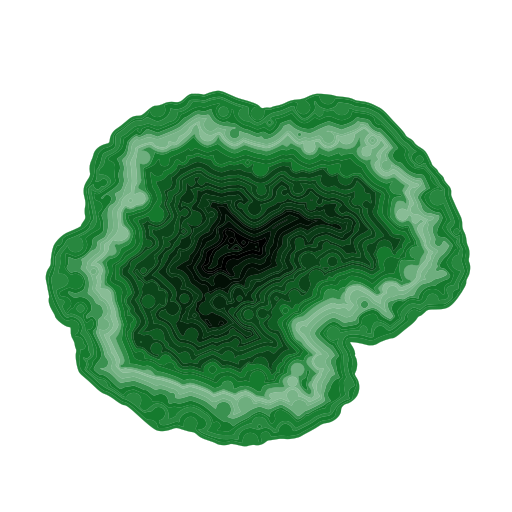
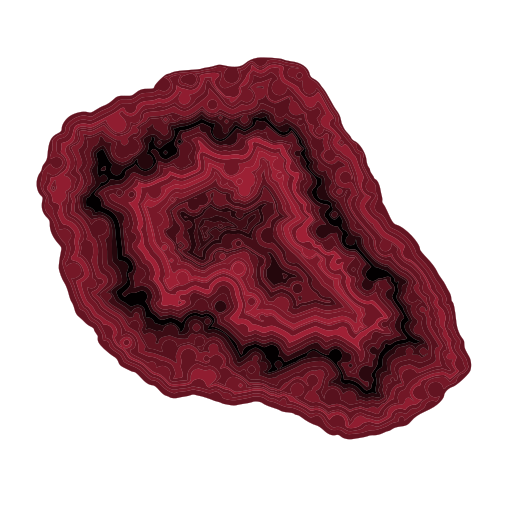
Agates.
My oldest project, first in Python, now in Rust : agates ! Mineral formations that I try to mimic here. It uses morphological operators to grow an agate.
Quasicrystals
Quasicrystals... Mysterious entities... a structure that is ordered but not periodic. A quasicrystalline pattern can continuously fill all available space, but it lacks translational symmetry.
This is an attempt to mimic them... With animation ! The symmetry seems to be everywhere but really is nowhere...
Snowflakes growth.
I have a deep love for all snowflakes. I often open a book, "Kenneth Libbrecht - The Art of the Snowflake, A Photographic Album" to see how complex they are. So when I found a paper on how to model snowflake growth, I had to implement it.
Modeling snow-crystal growth: A three-dimensional mesoscopic approach, by Janko Gravner and David Griffeath.
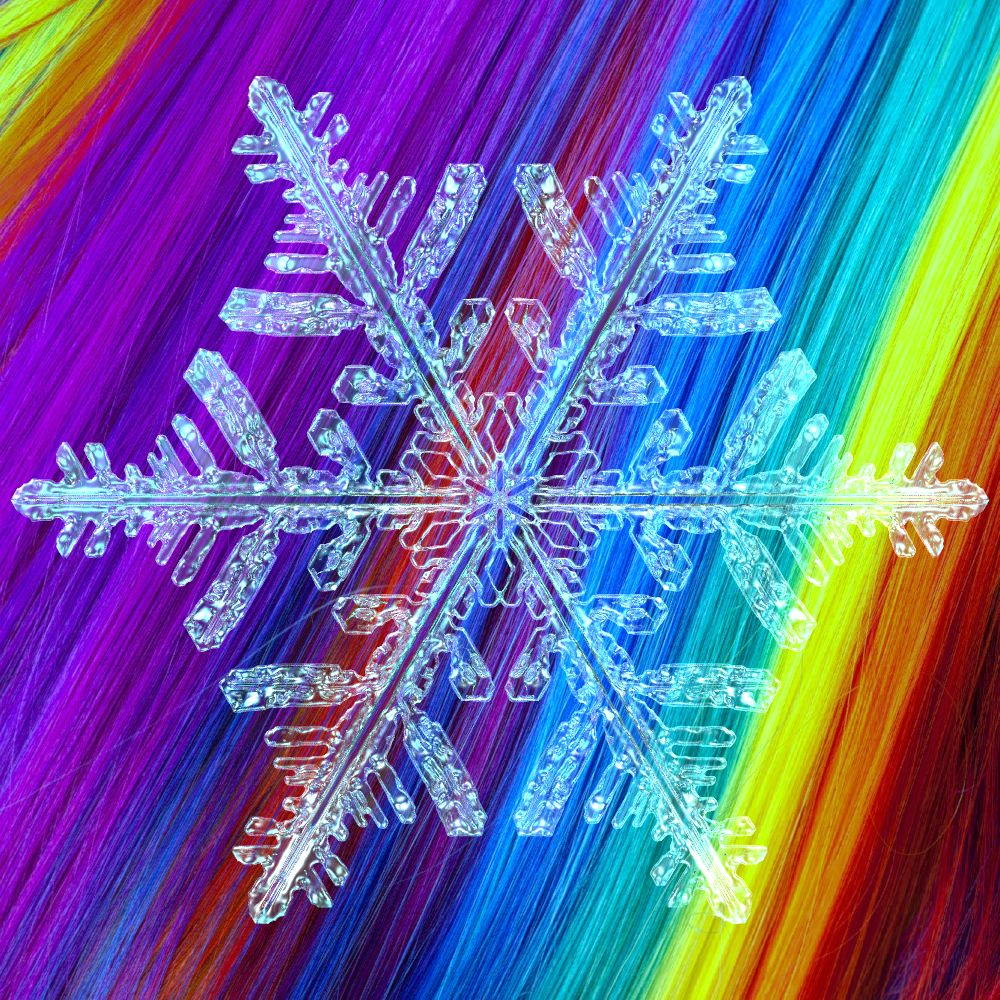
They are drawn using POV-Ray.
Spirograph.
I added a motion blur feature to my animation library and I just wanted to show you what it looks like with a spirograph animation !
Traveling Salesman Problem.
TSP stands for "Traveling Salesman Problem". It tells the story of a salesman willing to find the shortest path between all the cities he travels to, to sell his goods. Here, we draw the path he travels to reveal an image with meandering lines.
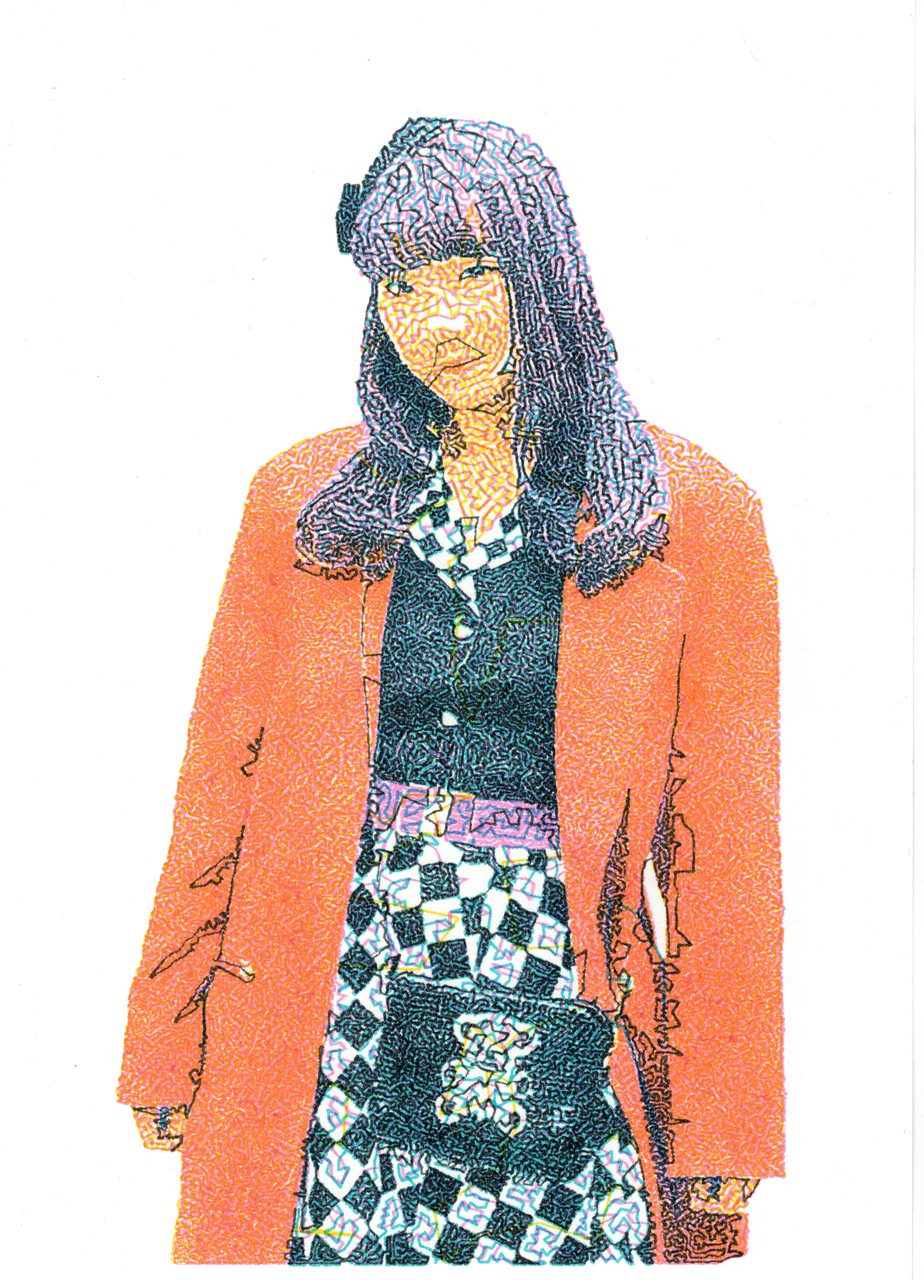
Stippling.
Stippling is the art of harmoniously placing "stipples", basically dots, to form an image.
This method can produce beautiful portraits or sceneries.
I use Linde-Buzo-Gray Weighted stippling method. It makes use of the previously developped Voronoï diagrams !
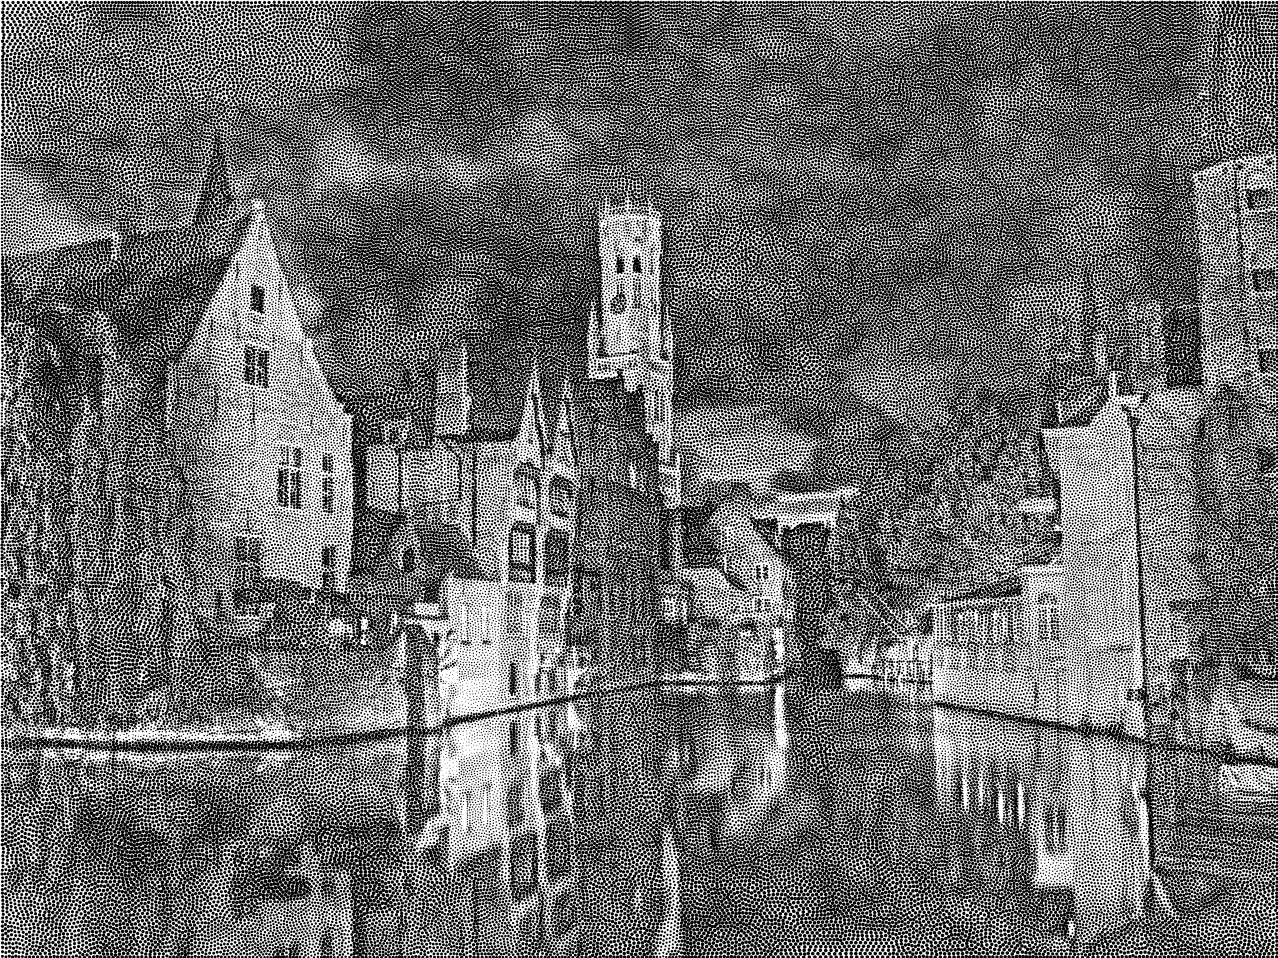
The other ones are drawn using a pen plotter !
Voronoi diagrams.
It took me some times, but I wanted to implement Fortune's algorithm to produce the Voronoï Diagram of a set of points in 2D, and I finally did. I originally thought of Voronoï diagram as a mathematical tool, but now I think that these diagrams can be beautiful by themselves. Take a look at the progression !
Wallpaper groups.
A wallpaper group is a mathematical classification of a two-dimensional repetitive pattern, based on the symmetries in the pattern. There is 17 wallpaper groups. I made an example of each one with a domain coloring technique. I'd like to thank Frank A. Farris for his amazing book "Creating Symmetry".
I'll first show the 17 groups, then how we can play with them by morphing them or animating them.
The 17 groups
P1
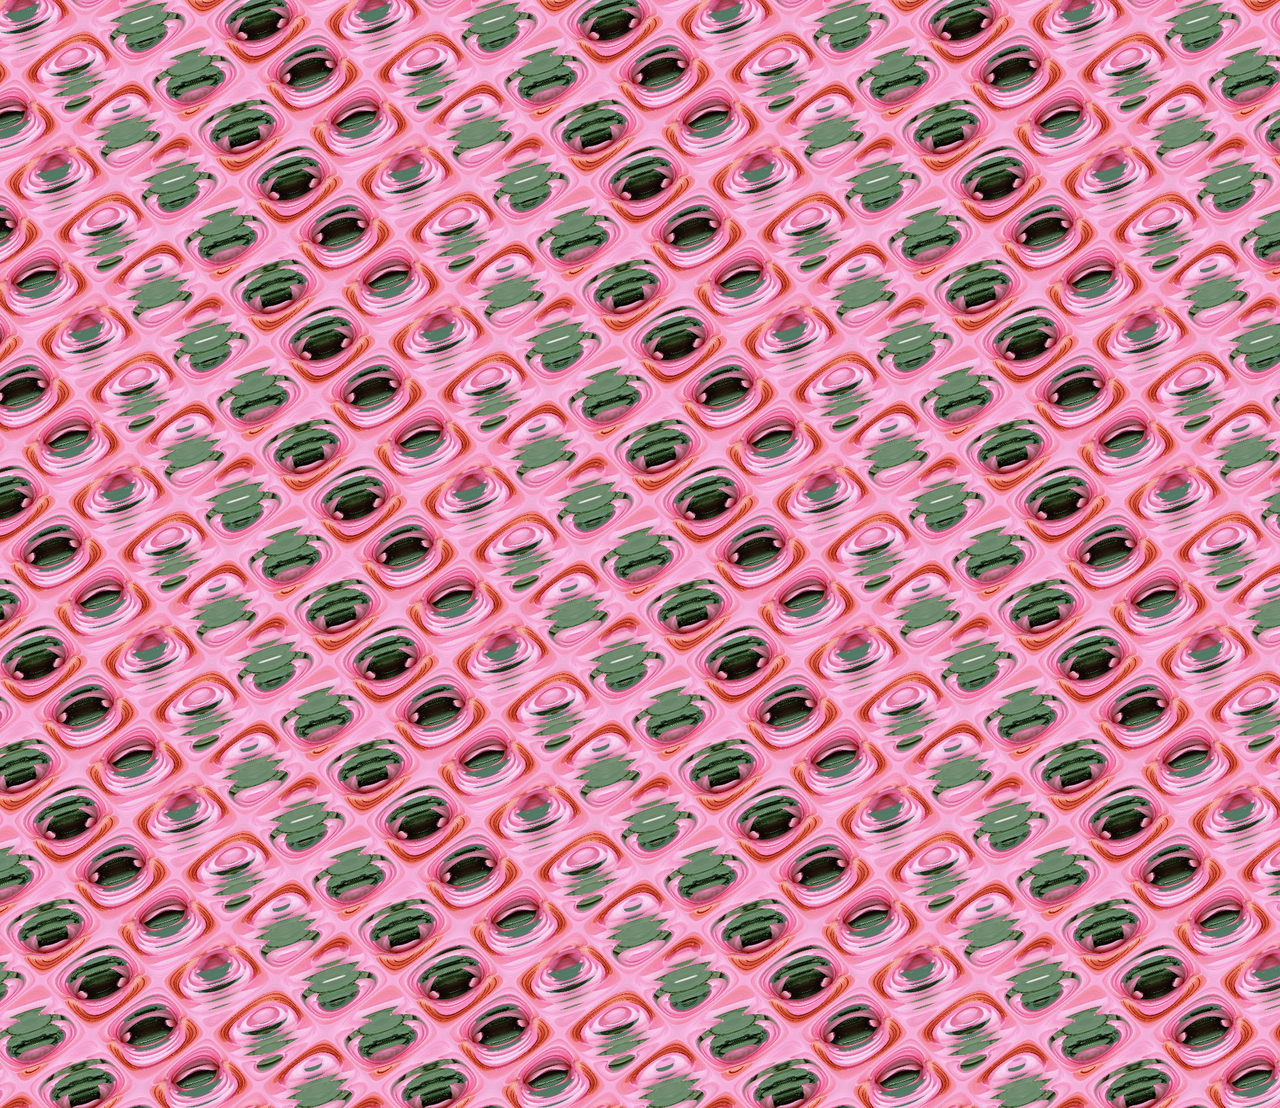
Truchet Patterns.
Jumping on a new project today. Browsing the internet the other day, I found a paper about Multi-scale Truchet Patterns and wanted to give it a try.
Truchet Patterns are made of tiles that can be gathered even at different scales to show a beautiful pattern.
I wanted to try my new animation code so here is an animation showing how rich Truchet patterns can be, even with the same tiles, when rotating them.